How 7 Brew Became One of the Fastest-Growing Drive-Thru Chains Ever
Disclosure: sevenbrewmenucoffee.com is an independent fan-run reference site not affiliated with 7 Brew Coffee Inc. The growth analysis in this article uses confirmed milestone data, trade press coverage, FDD-derived estimates, and this site’s own location news archive. “Fastest-growing” claims are examined with specific metric definitions and sourcing rather than repeated as received facts. This is the first external analysis that examines the claim rather than propagating it. Last updated: June 2026.
Every competitor 7 Brew fan site repeats the “fastest-growing drive-thru chain” narrative without examining what metric it is based on, whether it is accurate, or what comparisons would confirm or challenge it. This article does the examination that competitor sites do not attempt. The verdict is more nuanced than the unqualified claim – and more credible for it.
What “Fastest-Growing” Actually Means: Three Different Claims
Before assessing whether 7 Brew is the fastest-growing drive-thru chain, it is necessary to specify which version of the claim is being assessed. “Fastest-growing” in a franchise context can mean at least three different things, each requiring different data and producing different conclusions:
- Fastest by percentage growth: A chain going from 1 to 10 locations grew 900%. A chain going from 100 to 200 grew 100%. Percentage growth favors small starting bases and produces misleading comparisons at different scales. 7 Brew would score extremely high on this metric in its early years when starting from a single location.
- Fastest by absolute unit count addition per year: How many net new locations opened annually. This metric normalizes for starting base and is more meaningful for assessing whether a franchise system can actually sustain rapid physical expansion. This is the metric where 7 Brew’s claim is strongest.
- Fastest in a specific category or time window: “Fastest-growing specialty drive-thru chain” is a different and more defensible claim than “fastest-growing drive-thru chain ever.” Category and time window constraints make the comparison more precise.
The “fastest-growing drive-thru” claim as typically used by trade press appears to reflect the absolute unit count addition metric within the specialty beverage drive-thru category in the 2020-2026 timeframe – a more qualified version than the headline suggests. This article uses that qualified version as the baseline for analysis.
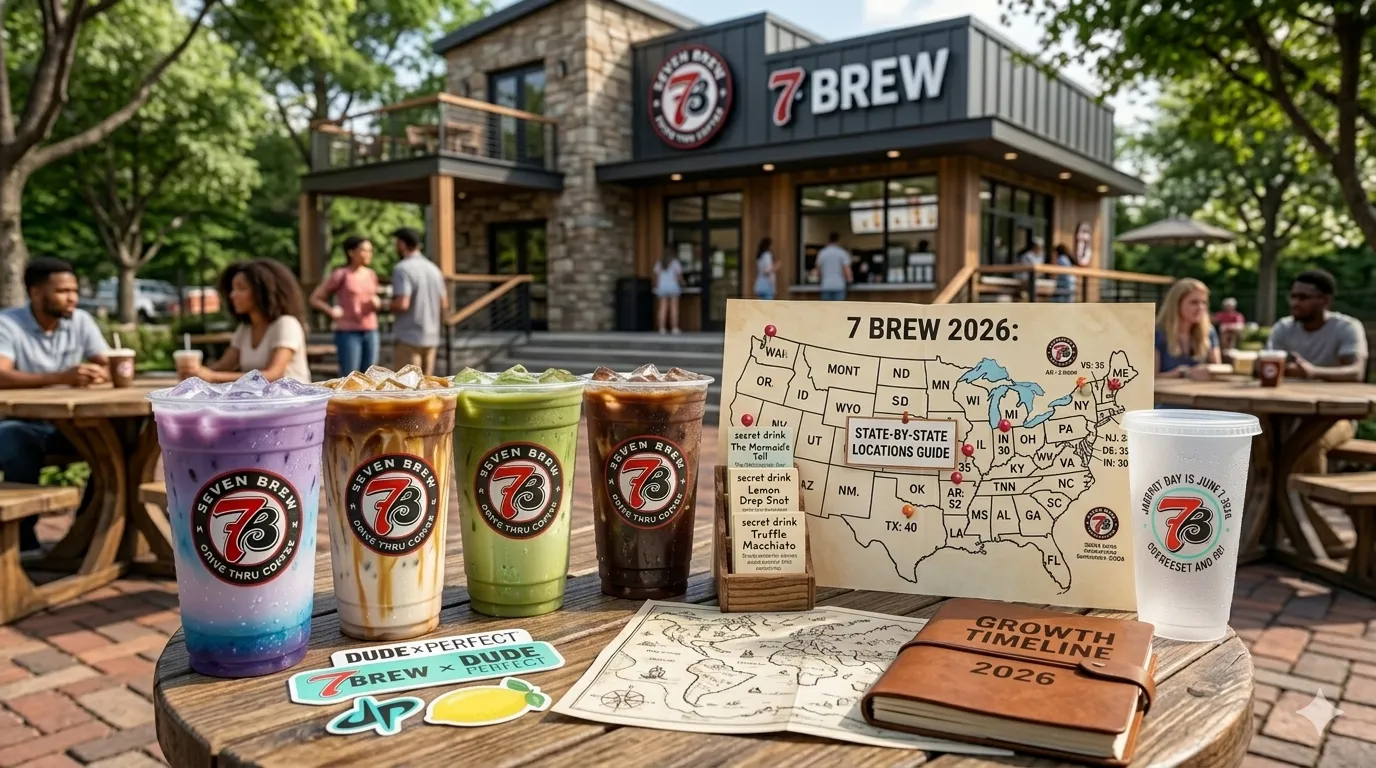
The Growth Story: From One Stand to National Scale in Eight Years
Roy Nettles founded 7 Brew Coffee in 2017 in Springdale, Arkansas with a single drive-thru stand. The founding format was purpose-built for scale: drive-thru only, no cafe seating, focused menu, and a multi-lane layout that could serve more cars per hour than a single-lane format. These operational choices were not accidental – they reflected a franchise design philosophy from the start rather than a founder-operated concept that only later evolved into a scalable model.
The brand reached the 700+ location milestone in 2025 – approximately 8 years from founding. That trajectory: 1 location in 2017, estimated 700+ by 2025, represents an average of approximately 87-88 net new locations per year across the full eight-year period. In the post-Blackstone Growth investment phase (2022 onward), the annual rate was meaningfully higher – estimated at 150-200+ net new locations per year based on the trajectory from the investment point to the confirmed 2025 milestone.
Methodology note: The 700+ figure is confirmed via the site’s own 2025 milestone coverage. Annual addition rate calculations use this confirmed endpoint and estimated intermediate year figures. The annual rate during the post-investment acceleration phase is an estimate, not a verified figure from 7 Brew or a primary document.
Why the Multi-Lane Drive-Thru Format Is the Key Enabler
The operational model that enables 7 Brew’s growth velocity is more important than any single business decision. The multi-lane drive-thru format – where 3-5 lanes converge at a central order-taking and drink-preparation station – creates a throughput capacity that changes the unit economics of a drive-thru coffee stand compared to a single-lane format.
Higher throughput per location means each franchise unit generates more revenue per operating hour, which means each operator is more profitable per location, which means franchisee recruitment is more compelling, which means the system can grow faster. The format also requires a simpler real estate footprint than a full-service cafe – a purpose-built kiosk on a smaller land parcel with parking designed for flow-through rather than destination parking. Lower real estate cost and complexity per location accelerates the new unit development pipeline.
A specific 7 Brew operational detail that illustrates this: the brand’s ordering system places the interaction at the speaker before the customer sees the board, with staff trained to guide the order experience. This reduces per-order time by reducing customer decision paralysis – the single biggest throughput constraint at a drive-thru is not preparation time, it is ordering time. Menu design choices like the named Seven Originals (the Blondie, Brunette, Sweet and Salty) give first-time customers a path to a quick decision without feeling overwhelmed by a customization menu.
The Five Factors Behind the Growth Velocity
Factor 1: Franchise-First Design From Day One
7 Brew was not a founder-operated concept that retrofitted a franchise model after proving the concept. The operational playbook, training infrastructure, and brand standards were designed with franchise replication in mind from early in the brand’s development. A franchise system that is designed for replication from the start grows faster than one that has to reverse-engineer its model into a replicable format after the fact.
Factor 2: Blackstone Growth Investment at Year Five
The Blackstone Growth investment in 2022 provided the capital infrastructure to sustain 150+ net new location additions per year. Before institutional capital, growth was self-funded through franchise fees and system royalties – a mechanism that works but limits annual addition rates to what the organic cash flow can support. PE capital eliminates that constraint by providing advance funding for franchisee recruitment, brand development, and operational support scaling that leads rather than follows location count growth.
Factor 3: A Pre-Built Consumer Market for Specialty Drive-Thru
Dutch Bros spent 25+ years building consumer awareness that a specialty drive-thru beverage experience is worth seeking out. When 7 Brew launched in 2017, that consumer behavior was already established in many markets. Customers in markets without a 7 Brew knew what a specialty drive-thru beverage experience was and were already looking for one – which reduces the customer acquisition cost and accelerates the new location ramp-up period when 7 Brew enters a new market.
Factor 4: TikTok-Native Brand Building Without Traditional Media Spend
7 Brew grew its brand awareness through organic TikTok content created by customers – not through television advertising, print campaigns, or traditional media buys. This reduces the brand-building cost per awareness unit significantly compared to traditional media-dependent QSR brands. When a new 7 Brew opens in a market where TikTok content has already built brand familiarity, the opening-day traffic is higher and the ramp-up period is shorter. The community-built brand awareness is a growth multiplier that does not appear on a capital expenditure line.
Factor 5: Demand-Signal Events That Validate the Model at Scale
Events like Jackpot Day and the 777 Celebration serve a dual purpose: they drive immediate customer traffic, and they generate community-documented demand signals that are visible to prospective franchisees evaluating whether 7 Brew locations generate the throughput that justifies the franchise investment. A prospective operator who sees photos and videos of line-out-the-road traffic at Jackpot Day events is getting visual confirmation of demand that a financial performance representation in an FDD cannot fully convey.
Industry Comparison: Contextualizing 7 Brew’s Growth Rate
| Chain | Years to 700 Locations (Est.) | Avg Annual Additions | Capital Context |
|---|---|---|---|
| 7 Brew Coffee | ~8 years (2017-2025, confirmed) | ~87+ per year average (est.) | Bootstrapped years 1-5; Blackstone from year 5 |
| Dutch Bros Coffee | ~25-30 years (1992-est. 2018, estimate) | ~25-30 per year average (est.) | Bootstrapped for ~20 years; accelerated post-IPO 2021 |
| Scooter’s Coffee | ~22+ years to reach similar scale (est.) | ~30-40 per year average recent years (est.) | PE-backed in later growth phase |
| Starbucks (for scale context) | ~18 years to 700 US locations (est.) | ~40 per year average early period (est.) | IPO in 1992; corporate-owned model differs fundamentally |
All “years to 700 locations” and annual addition figures for comparison chains are estimates based on available trade press, public filing data where applicable (Starbucks historical filings, Dutch Bros SEC filings post-2021), and analyst reports. Starbucks comparison is included for industry context only – its corporate-owned model is not directly comparable to a franchise system. These comparisons are directional rather than precise. 7 Brew’s 8-year trajectory to 700+ is a confirmed data point; all comparison chain timelines are estimates.
The table supports a qualified version of the “fastest-growing” claim: within the specialty drive-thru beverage category, 7 Brew’s 8-year trajectory to 700+ locations is faster than any documented comparable chain at an equivalent starting point. The qualification matters – “fastest in specialty drive-thru category in the modern PE-backed franchise era” is defensible; “fastest drive-thru chain ever” requires broader comparative data that is not publicly available.
Record-Setting Demand Days: The Demand Validation Evidence
The fastest-growing drive-thru claim is not just about location count – it is also about whether the locations generate the throughput that justifies rapid expansion. Demand-side evidence comes from documented high-traffic events.
Jackpot Day is 7 Brew’s most significant documented demand event – a promotional pricing day that generates community-documented multi-hour wait lines at locations across the system. The June 7 Jackpot Day is an example of a system-wide promotional day where community-reported traffic at individual locations suggests car volume significantly above typical daily throughput. Wait times of 30-60 minutes at some locations are community-reported during Jackpot Day events – a traffic level that few drive-thru promotions at comparable chains generate.
Important caveat: Jackpot Day traffic reports are sourced from community observation on Reddit r/7Brew and social media. They are not verified operational data from 7 Brew. Individual location traffic varies significantly based on market size, location, and promotional execution. Community-reported wait times are directional indicators, not systematically measured throughput data.
New location opening days also serve as demand validation events. Community reports from recent openings in markets like West Fargo and Fairborn, Ohio document significant opening-day traffic in markets where 7 Brew is establishing its first presence. High opening-day traffic in new markets is a leading indicator that consumer demand exists ahead of the brand’s physical arrival – driven by the TikTok community building that precedes many 7 Brew market entries.
The Sustainability Question: Is This Growth Rate Maintainable?
A growth rate this high invites a legitimate question: can it be sustained? The honest answer is that it probably cannot be sustained indefinitely – and that is normal, expected, and not a negative signal about the brand’s health.
Every franchise system that grows rapidly eventually decelerates. The deceleration happens because the most attractive market slots fill up first – the highest-traffic locations in the most brand-aware markets are developed by the franchisees who moved earliest. As growth continues, the remaining undeveloped markets are either smaller, more competitive, or require more franchisee development effort to penetrate. This is market saturation dynamics, not brand failure.
What the current growth pattern suggests for sustainability: 7 Brew’s 2025-2026 expansion into genuinely new geographic markets – Connecticut, the Northeast, Florida markets – indicates that the brand is still in its geographic expansion phase rather than saturating existing markets. That pattern suggests the growth rate is more likely to plateau than to collapse – a gradual deceleration toward a sustainable steady-state addition rate as new market entries compensate for reduced addition rates in established markets.
The customer experience dimension of the sustainability question: rapid franchise growth creates genuine risk of inconsistent quality as training and support infrastructure struggles to keep pace with new location openings. The honest 7 Brew product review addresses the question of whether the drink experience varies meaningfully across locations. Anecdotally, community observation suggests drink quality is generally consistent but not perfectly uniform – the expected pattern for a large franchise system.
Why This Growth Story Matters Beyond the Numbers
For franchise prospects, the growth velocity is a double-edged signal. On the positive side: a system adding 150+ locations per year has proven its franchisee recruitment and support infrastructure can sustain that pace – a strong operational signal. On the cautionary side: the most attractive remaining market opportunities have been claimed by earlier entrants. A franchise prospect evaluating 7 Brew in 2026 is entering a more mature system than someone who did in 2021.
For customers in markets where 7 Brew has not yet arrived: the geographic expansion pattern suggests continuous frontier expansion. New market entry announcements appear on the 7 Brew news blog as they occur. If you are in a market that 7 Brew has not yet entered, the question is not whether 7 Brew will arrive in your region but when – and that depends on whether a franchise operator has been recruited for your specific market.
For industry observers: 7 Brew’s growth trajectory represents a case study in what PE-backed franchise acceleration looks like when the underlying unit economics support rapid expansion. The model does not work if individual franchise units are not profitable – unprofitable units generate franchisee attrition that slows or reverses system growth. The fact that 7 Brew continued adding locations at high rates after the Blackstone investment is evidence, though not confirmation, that the underlying unit economics are supporting rather than undermining the expansion rate.
- Repeating “fastest-growing drive-thru ever” without defining the metric: The claim is defensible when qualified – fastest in specialty drive-thru category in the PE-backed franchise era by absolute unit count. The unqualified “ever” version would require comparison data across all QSR history that is not publicly available. Use the qualified version.
- Treating rapid growth as confirmation of strong unit economics: A franchise system can grow rapidly even if individual units are underperforming, if franchise fees, royalties, and brand-building rationale give corporate enough incentive to continue recruiting operators. Growth rate and franchisee profitability are separate metrics requiring separate data sources (FDD Item 19 for unit economics).
- Using milestone announcement figures as current location counts: The 700+ figure reflects 2025. The actual count in mid-2026 is higher. Every citation of a 7 Brew location count must carry the date it reflects.
- Confusing market entry with market presence: Opening one location in Connecticut is a market test, not a Connecticut market presence. Established market presence requires density within reasonable drive of most residents – 7 Brew has that in Arkansas, Oklahoma, and Missouri but not yet in most recently entered states.
- Assuming growth deceleration signals brand problems: Every franchise system decelerates eventually as available market slots fill and growth economics normalize. When 7 Brew’s annual addition rate moderates from its 2022-2025 peak, that will be a normal maturation signal, not evidence of brand decline.
Key Numbers Reference
- Founding year: 2017
- 700+ location milestone achieved: 2025 (confirmed)
- Years from 1 to 700+ locations: Approximately 8
- Estimated average annual location additions (full period): ~87+ per year
- Estimated post-Blackstone peak annual additions (2022-2025): ~150-200+ per year (estimate)
- States with 7 Brew presence: 38+ (confirmed, 2025)
- Franchise model: 100% franchise-operated; no corporate locations
- Blackstone Growth investment year: 2022
- Current estimated count (June 2026): 750-800+ (estimate)
Related Articles
- 7 Brew Hits a Major Growth Milestone in 2025 – the confirmed 700+ milestone that anchors the growth claims analyzed in this article
- How Many 7 Brew Locations Are There? – current location count reference with geographic breakdown
- 7 Brew Jackpot Day – the demand validation event that documents peak community-reported traffic
- Is 7 Brew Really That Good? – honest product quality review relevant to the sustainability question
- 7 Brew News Blog – ongoing new market entry coverage that documents the expansion frontier in real time
Frequently Asked Questions
Is 7 Brew the fastest-growing drive-thru chain ever?
Within the specialty drive-thru beverage category in the 2017-2025 timeframe, 7 Brew’s growth velocity – 700+ locations in approximately 8 years from a single stand – appears exceptional and difficult to match against comparable chains at equivalent developmental stages. The unqualified “ever” version of the claim would require comparative data across all QSR history that is not publicly available for a definitive conclusion. The qualified claim is more defensible and more credible.
How many new 7 Brew locations open per month?
Based on estimates derived from the confirmed 700+ milestone and the estimated trajectory from the 2022 Blackstone investment: approximately 12-17 net new locations per month on average during the post-investment acceleration phase (2022-2025). The current rate in 2026 may be moderating. These are estimates from milestone data, not confirmed operational figures.
What made 7 Brew grow so fast?
Five primary factors: franchise-first operational design from the founding, Blackstone Growth private equity capital at year five that funded accelerated franchisee recruitment, a pre-built consumer market for specialty drive-thru beverages created by Dutch Bros over its prior 25 years, TikTok-native organic brand building that reduced customer acquisition costs in new markets, and demand validation events like Jackpot Day that signal strong unit economics to prospective franchisees.
Is 7 Brew growing too fast?
Rapid growth creates legitimate risks – franchisee quality dilution, training infrastructure strain, supply chain complexity, and brand culture preservation at scale. The evidence that 7 Brew is managing these risks adequately is that growth continued at high rates post-Blackstone and community-documented customer experience remains generally positive. The evidence that warrants ongoing monitoring is that consistent quality execution across 750+ independent franchise operations is genuinely difficult, and unit-level economics data requires FDD review rather than external assessment.
Summary: The Qualified Verdict on the Fastest-Growing Claim
7 Brew’s growth from a single Arkansas stand to 700+ locations in approximately 8 years is genuinely exceptional in the specialty drive-thru beverage category. The “fastest-growing” claim, when qualified to the specialty drive-thru beverage segment in the modern PE-backed franchise era, is supported by the available data. The unqualified superlative – “fastest ever in all of drive-thru history” – cannot be definitively confirmed without comparative data that does not exist publicly.
The growth was made possible by a combination of factors that are partially replicable (franchise-first design, PE capital availability) and partially context-specific (Dutch Bros’ 25-year market education, TikTok as a brand-building platform, a favorable specialty beverage consumer demand environment in the 2017-2025 period). Future brands attempting to replicate 7 Brew’s trajectory will face a different context – including 7 Brew itself as an established market competitor in many regions they might want to enter.
sevenbrewmenucoffee.com is an independent fan site not affiliated with 7 Brew Coffee Inc. All growth estimates carry the uncertainty inherent in analyzing a privately held company without access to verified internal data. FDD review and independent professional analysis are appropriate for franchise investment decisions. Last verified June 2026.