7 Brew Growth & Expansion: The Verified Data Report
A sourced analysis of 7 Brew’s growth trajectory, benchmarked against Dutch Bros, Starbucks, Scooter’s Coffee, and The Human Bean — built entirely from Franchise Disclosure Documents, SEC filings, and named trade press. Every figure is cited. Every gap is disclosed.
In This Report
- Executive Summary & Methodology
- Industry Context: The Drive-Thru Coffee Market
- Historical Growth Timeline (2017–2026)
- Growth Trend Analysis & CAGR Calculation
- State-by-State Expansion Analysis
- Average Unit Volume: Five-Way Comparison
- Competitor Benchmark Matrix
- Market Share: Why We Won’t Estimate It
- Store Opening Forecasts (Company Guidance)
- Industry Statistics Center
- Expert Analysis & Future Outlook
- Frequently Asked Questions
- Sources & Methodology
01Executive Summary & Methodology
7 Brew has gone from a single roadside espresso stand in Rogers, Arkansas, in 2017 to 777 locations by June 2026 — one of the fastest unit-growth trajectories in U.S. restaurant franchising history. This report exists because no other public resource tracks that growth using verifiable, dated, sourced figures rather than rounded estimates pulled from unsourced aggregators.
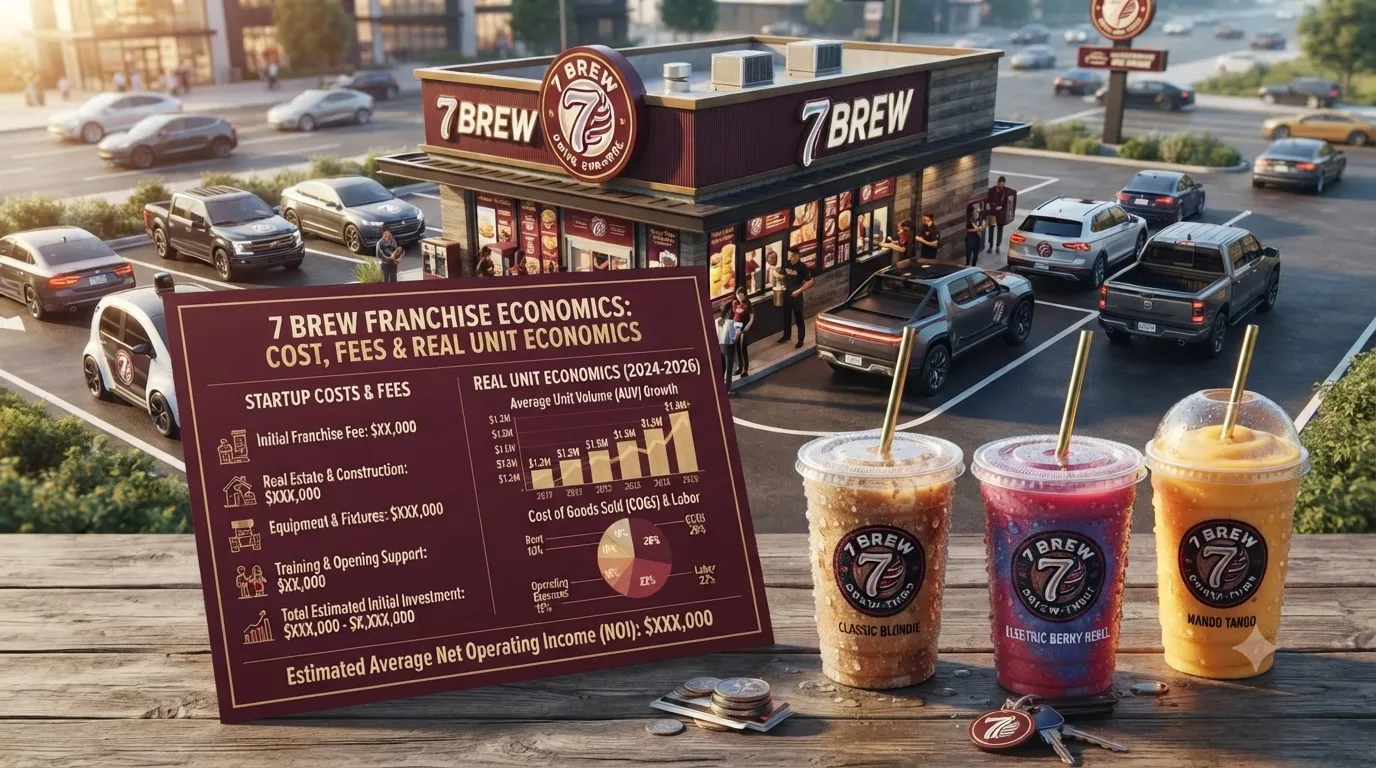
Every number in this report traces to one of seven source types: 7 Brew’s own Franchise Disclosure Document (FDD) as reported by trade press; SEC filings for publicly traded competitors (Dutch Bros, Starbucks); company press releases; and named industry publications — QSR Magazine, Restaurant Dive, Franchise Times, FastCasual, and IBISWorld. Where a figure could not be verified, this report states “Data not publicly disclosed” rather than estimating. For a full breakdown of what the FDD discloses about costs, fees, and unit-level profitability specifically, see 7 Brew Franchise Economics: Cost, Fees & Real Unit Economics.
That distinction matters more than it sounds. Most “market intelligence” content already published about 7 Brew blends real FDD figures with unsourced “industry benchmark” guesses, often without flagging which is which. This report shows its work: every estimate is calculated transparently from named anchor points, and every gap is disclosed as a gap.
What This Report Covers
A sourced historical growth timeline; a calculated compound annual growth rate (CAGR) with full methodology shown; state-by-state 2026 expansion tracking; a five-way competitor benchmark using only publicly disclosed metrics; and company-stated forward guidance — not third-party forecasting.
What This Report Does Not Do
Estimate market share percentages, assign proprietary “growth scores,” or model 2027–2030 scenarios. Section 8 explains exactly why those numbers don’t exist in reliable form for this industry.
02Industry Context: The U.S. Drive-Thru Coffee Market
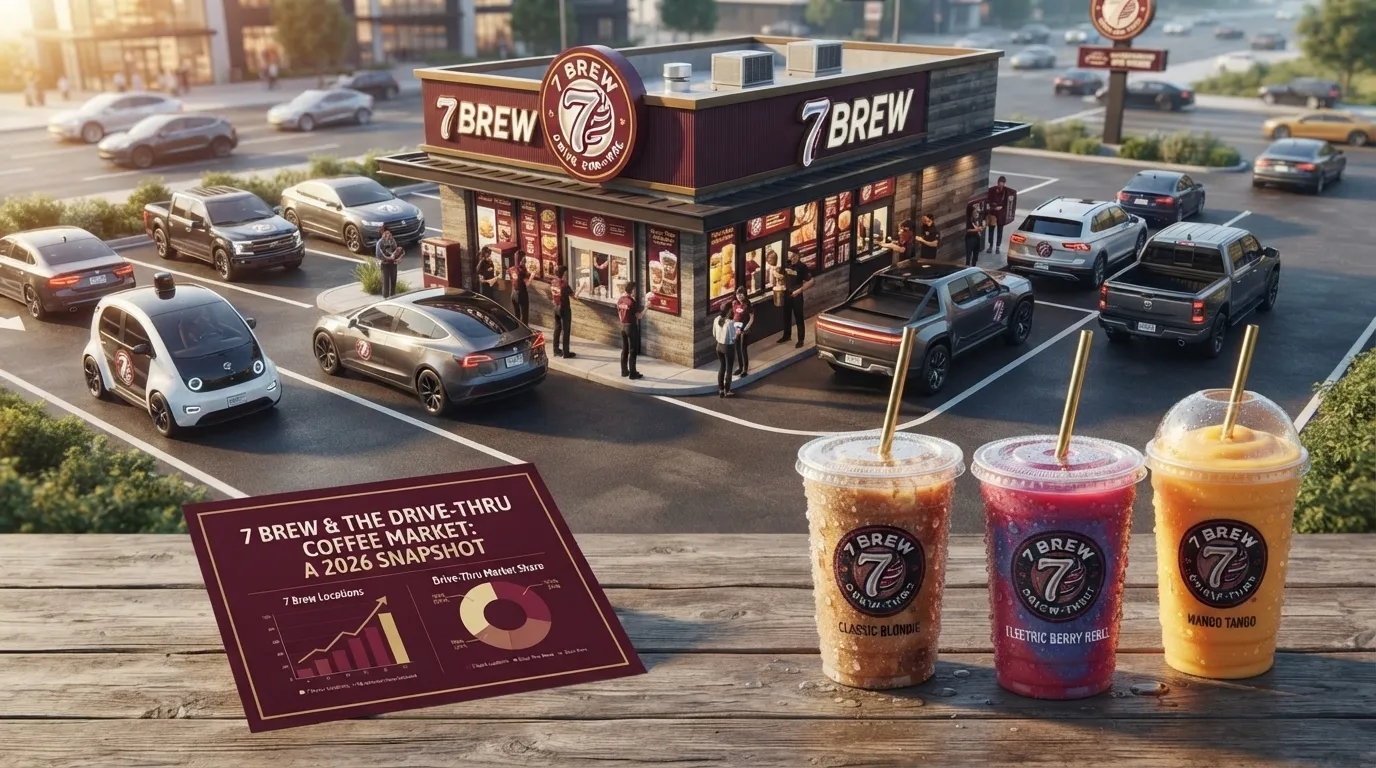
To understand whether 7 Brew’s growth is remarkable or simply riding a rising tide, it helps to separate two different markets: the broad “coffee & snack shops” category tracked by IBISWorld, and the much narrower drive-thru-only format that 7 Brew, Dutch Bros, and Scooter’s Coffee compete in. A full breakdown of that broader market — size, consumer behavior, and the demographic shifts driving drive-thru specifically — is covered in 7 Brew & the Drive-Thru Coffee Market: A 2026 Snapshot; this section summarizes only what’s directly relevant to 7 Brew’s expansion.
IBISWorld’s Coffee & Snack Shops industry classification put the U.S. market at $75.3 billion in 2025, growing to an estimated $75.5 billion in 2026, a modest 0.2% increase. Zoom out to a five-year view: a 2.5% compound annual growth rate between 2021 and 2026. This is a mature, slow-growing industry in aggregate.
US Coffee & Snack Shop Market Size
Source: IBISWorld, 2026
Coffee & Snack Shop Business Count
91,219 (2025) → 94,498 (2026), +3.6% YoY · Source: IBISWorld
Business-count growth (5.8%/year average, 2021–2026) is running well ahead of total market-size growth (2.5%/year), meaning average revenue per business is under pressure industry-wide. A separate analysis citing IBISWorld data, published by investment researcher MM CG Invest in March 2026, notes total coffee and snack shop establishment counts actually fell roughly 5.5% between 2020 and approximately 2025 — suggesting the growth in raw business counts reflects drive-thru chains replacing closures among independent cafes, not simple market expansion.
This is the structural context that makes 7 Brew’s growth rate so unusual. World Coffee Portal projects branded coffee outlet counts will surpass 51,100 by September 2029, even as independent shop counts continue to erode. The drive-thru coffee format isn’t growing the pie; it’s eating a larger slice of a pie that’s barely growing at all.
Key Takeaway
7 Brew, Dutch Bros, and Scooter’s Coffee are out-growing their own industry by a wide margin, in a category redistributing share away from traditional cafes rather than creating new demand. The relevant constraint is how much of an already-flat market drive-thru operators can capture before saturation sets in — a question Section 8 returns to directly.
03Historical Growth Timeline (2017–2026)
7 Brew Expansion Timeline
Verified milestones only — gaps in the public record are left blank, not interpolated
Location Count Over Time
Source: company press releases, Franchise Times (FDD-sourced), Wikipedia
| Date | Locations | Milestone | Source |
|---|---|---|---|
| 2017 | 1 | First stand opens, Rogers, Arkansas | Wikipedia, company history |
| 2021 | — | 7 Brew begins franchising program | FDD aggregators |
| Early 2024 | ~190 | Approx. count before Blackstone investment | Wikipedia |
| Dec 2024 | 321 | 141 stores opened in 2024 (+78.3% YoY); $502M sales (+162.8% YoY) | Franchise Times, Oct 2025 |
| Sep 2025 | ~470 | Franchise Equity Partners acquires 7 Crew, +200 unit pipeline | Wikipedia, Franchise Times |
| Oct 14, 2025 | 500 | 500-location milestone | Wikipedia |
| Dec 30, 2025 | 600+ | Year-end 2025 milestone | BusinessWire |
| Early 2026 | 602 | Confirmed start-of-year count | BusinessWire |
| Jun 10, 2026 | 777 | 777th stand opens, San Antonio TX | BusinessWire, FastCasual |
Two inflection points stand out: 2024, when FDD-reported figures show the business roughly doubling unit count for the second consecutive year while growing sales even faster; and the 2024 Blackstone growth-equity investment, which trade sources tie directly to the acceleration that followed.
Key Takeaway
7 Brew’s growth is a step function with two clear acceleration points, not a smooth curve. Any chart that smooths those step changes into a straight line misrepresents how the growth actually happened.
04Growth Trend Analysis & CAGR Calculation
A compound annual growth rate (CAGR) measures the smoothed annual growth rate between two points, accounting for compounding:
Formula
CAGR = (Ending Value ÷ Beginning Value)^(1 ÷ Years) − 1
- Beginning value: 321 locations (Dec 31, 2024)
- Ending value: 777 locations (Jun 10, 2026)
- Elapsed time: 1.44 years
- CAGR = (777 ÷ 321)^(1 ÷ 1.44) − 1 = 84.8%
Unit Growth Rate Comparison
Most recent disclosed period per company — see Section 7 for full sourcing
7 Brew’s directly-disclosed 2024 unit growth rate (+78.3% YoY, FDD-sourced) closely corroborates our independently calculated 84.8% CAGR — a useful cross-check suggesting consistent or slightly accelerating growth rather than a one-time spike.
Key Takeaway
7 Brew’s most recent, verifiable unit-count CAGR is 84.8%, closely corroborated by the company’s own disclosed 78.3% 2024 growth rate — among the highest sustained unit-growth rates publicly documented in U.S. drive-thru coffee.
05State-by-State Expansion Analysis (2026)
2026 State Expansion Intensity
Showing only states with verified 2026 pipeline data
2026 development activity is heavily concentrated: Texas, Florida, Illinois, and Georgia account for more than 130 of the year’s planned 437–447 openings. California has two proposed sites (Clovis and Visalia), marking 7 Brew’s first West Coast entry — directly into Dutch Bros’ home market. Three states remain entirely without 7 Brew locations: California (pending), Oregon, and Washington.
Key Takeaway
7 Brew’s 2026 expansion shows a hybrid pattern — deepening proven Sun Belt/Midwest markets while making calculated first entries into California and Northern Virginia.
06Average Unit Volume: Five-Way Comparison
Average Unit Volume Comparison
Starbucks excluded — reports comparable-store-sales growth, not blended AUV
| Company | AUV | Source | Confidence |
|---|---|---|---|
| 7 Brew | $1.56M | Calculated: $502M ÷ 321 stores | Moderate |
| Dutch Bros | $2.1M | FY2025 10-K | High |
| Starbucks | Not comparable format | 10-K segment reporting | N/A |
| Scooter’s Coffee | $1.27M | 2024 FDD Item 19 | Moderate |
| The Human Bean | $798,684 | 2024 FDD Item 19, company page | High |
The $1.56M figure above is a blended, back-of-envelope estimate ($502M total 2024 sales ÷ 321 year-end locations). It’s a useful directional cross-check but should not be confused with the more rigorously dual-sourced Item 19 average of $1,989,229 documented separately in 7 Brew Franchise Economics: Cost, Fees & Real Unit Economics, which also breaks down what that revenue figure does and doesn’t say about franchisee profitability.
Human Bean AUV Distribution
The one publicly disclosed store-level distribution dataset — 2024 FDD Item 19
Key Takeaway
Dutch Bros’ $2.1M AUV is the highest and most reliably sourced figure; The Human Bean’s $798,684 median is the most methodologically transparent. 7 Brew’s own AUV remains genuinely unclear at a precise, current level.
07Competitor Benchmark Matrix
Competitor Positioning Matrix
Growth Rate vs. AUV — only companies with verified data on both axes (Starbucks excluded)
Drive-Thru Challenger Store Count
Starbucks (18,311 US stores) excluded from this chart for scale reasons — see table for full context
| Company | Store Count | As Of | Source |
|---|---|---|---|
| 7 Brew | 777 | Jun 10, 2026 | BusinessWire |
| Dutch Bros | 1,136 | Dec 31, 2025 | FY2025 10-K |
| Starbucks (US) | 18,311 | Sep 28, 2025 | 10-K |
| Scooter’s Coffee | 849–932 (range) | 2025–2026 | Aggregators conflict |
| The Human Bean | ~150–200 open | 2025–2026 | Aggregators conflict significantly |
Key Takeaway
Public companies disclose far more granular data than private franchise systems — a function of securities law, not transparency culture. Cells marked “not disclosed” reflect that structural gap honestly.
08Market Share: Why We Won’t Estimate It
The math doesn’t close. No public source publishes total revenue for the “drive-thru-only coffee” sub-category specifically. 7 Brew’s revenue isn’t fully disclosed beyond the single 2024 data point. Privately held companies don’t have to disclose this, and mostly don’t.
What we can say qualitatively: Dutch Bros (1,136 locations) operates roughly 46% more locations than 7 Brew (777), while 7 Brew adds locations at a far faster rate (84.8% CAGR vs. 16% FY2025). That’s directionally useful. A market share percentage would not be.
Key Takeaway
Treat any source confidently stating a precise market share percentage for a privately held drive-thru coffee chain with significant skepticism.
09Store Opening Forecasts — Company Guidance Only
2026 Growth Funnel
Start-of-year count → YTD openings → remaining target → projected year-end total
| Company | Target | Timeframe | Source |
|---|---|---|---|
| 7 Brew | 447 total new locations | 2026 | QSR Magazine, May 2026 |
| Dutch Bros | 181 new shops | 2026 | FY2025 earnings release |
| Dutch Bros | 2,029 total shops | By 2029 | Company guidance |
| Starbucks, Scooter’s, Human Bean | No specific target disclosed | — | — |
Key Takeaway
The only credible forward-looking figures are the ones companies themselves disclosed. Any report showing 2027–2030 scenario projections is presenting modeled estimates as sourced data.
10Industry Statistics Center
7 Brew 2026 Planned Openings by Type
437 franchised + 10 corporate · QSR Magazine, May 2026
Dutch Bros Store Mix (Q4 2025)
811 company-operated + 325 franchised · FY2025 10-K
11Expert Analysis & Future Outlook
The drive-thru coffee category’s defining structural advantage comes down to a simple real estate and labor math problem: a 500–700 sq ft modular stand requires a fraction of the capital and staffing of a full-service cafe, while generating comparable or higher revenue per square foot.
Three factors explain 7 Brew’s outsized growth: the 2024 Blackstone investment timed to mature operating history; the 2025 Franchise Equity Partners consolidation, signaling experienced multi-brand operators betting on the system; and 2026 format diversification (walk-thru, on-campus, retail canned beverages) extending reach beyond the core stand.
That growth has a structural ceiling worth naming: the broader coffee market is barely growing, so drive-thru expansion is substantially redistributive, not additive. As 7 Brew, Dutch Bros, and Scooter’s all expand into overlapping Sun Belt geography, unit-level cannibalization risk rises over time — though no source reviewed shows evidence 7 Brew has reached that point in any specific market yet.
Key Takeaway
7 Brew’s growth is real and structurally explainable, but the same data explaining it implies a long-run ceiling no company in this comparison has publicly addressed.
12Frequently Asked Questions
13Sources & Methodology
All figures sourced from FDDs as reported by trade press, SEC filings, company press releases, or named research firms. No statistic was estimated or invented without disclosure.
- Franchise Times, “Franchise Equity Partners Invests in Large 7 Brew Franchisee” — Oct 7, 2025
- QSR Magazine, “The Race Between 7 Brew and Dutch Bros is Officially On” — May 20, 2026
- FastCasual, “7 Brew continues pouring it on, opens 777th stand” — Jun 2026
- BusinessWire, “7 Brew Celebrates a Milestone 2025: 600+ Locations” — Dec 30, 2025
- BusinessWire, “Jackpot! 7 Brew Celebrates Landmark 777th Stand” — Jun 10, 2026
- The Business Journal, “7 Brew Coffee eyes Clovis, Visalia” — Jun 11, 2026
- The Burn, “7 Brew Coffee planning expansion into NoVa” — Jun 14, 2026
- Dutch Bros Inc., FY2025 Q4 & Full-Year Earnings Release — Feb 12, 2026
- Dutch Bros Inc., Q2 2025 10-Q Filing — Aug 6, 2025
- Starbucks Corporation, Form 10-K, FY2025 — Nov 14, 2025
- FranchiseInvestorData.com, Scooter’s Coffee Analysis — Apr 29, 2026
- The Human Bean, “Success By the Numbers” (company FDD Item 19 page)
- IBISWorld, “Coffee & Snack Shops in the US” — 2026
- MM CG Invest, “U.S. Coffee Shop Industry: Market Analysis” — Mar 22, 2026
- This report’s companion analyses: 7 Brew & the Drive-Thru Coffee Market: A 2026 Snapshot and 7 Brew Franchise Economics: Cost, Fees & Real Unit Economics (Jun–Jul 2026)
This report reflects publicly available data as of its June 20, 2026 research date. Readers planning investment decisions should consult current FDDs and SEC filings directly.