7 Brew & the Drive-Thru Coffee Market: A 2026 Snapshot
Where 7 Brew sits inside a $75.5 billion industry, what’s actually driving drive-thru coffee growth, and what the numbers say about the market’s ceiling — sourced from IBISWorld, the National Coffee Association, and named trade publications.
In This Report
01The Broader Market: Size & Growth
The U.S. coffee and snack shop industry — the broadest category that includes everything from independent cafes to major chains to drive-thru-only concepts — reached an estimated $75.5 billion in revenue in 2026, according to IBISWorld. That figure has grown at a 2.5% compound annual growth rate (CAGR) between 2021 and 2026, representing steady but unspectacular expansion in a category IBISWorld itself describes as mature.
To put the slow headline growth rate in perspective: 94,498 coffee and snack shop businesses operated in the U.S. in 2026, up from 91,219 in 2025 — a 3.6% single-year increase in business count that is running faster than total revenue growth. When businesses proliferate faster than total spending rises, average revenue per business is under pressure. That’s the aggregate story of the coffee shop industry in 2026: more operators competing for a pool of spending that isn’t growing as fast as they are.
US Coffee & Snack Shop Industry Revenue — 2020 to 2030
Source: IBISWorld 2026 — 2030 figure is IBISWorld forecast, shown as estimate
Bars scaled from $0–$85B · CAGR 2.5% (2021–2026), forecast to slow to 1.3% (2025–2030) · Source: IBISWorld 2026
Market-size figures vary widely depending on scope and methodology. IBISWorld’s $75.5 billion covers the full coffee and snack shop operating category. World Coffee Portal, focusing only on branded coffee shops, estimated the market at $54 billion in 2024 and projected growth to $72 billion by 2028. Grandview Research’s specialty coffee segment specifically was valued at $47.8 billion in 2024. Mordor Intelligence, examining a narrower foodservice channel definition, projected $29.1 billion for 2025. These figures aren’t contradicting each other — they’re measuring different slices of the same pie — but readers citing any single market-size figure should understand exactly which slice it refers to.
Important Context
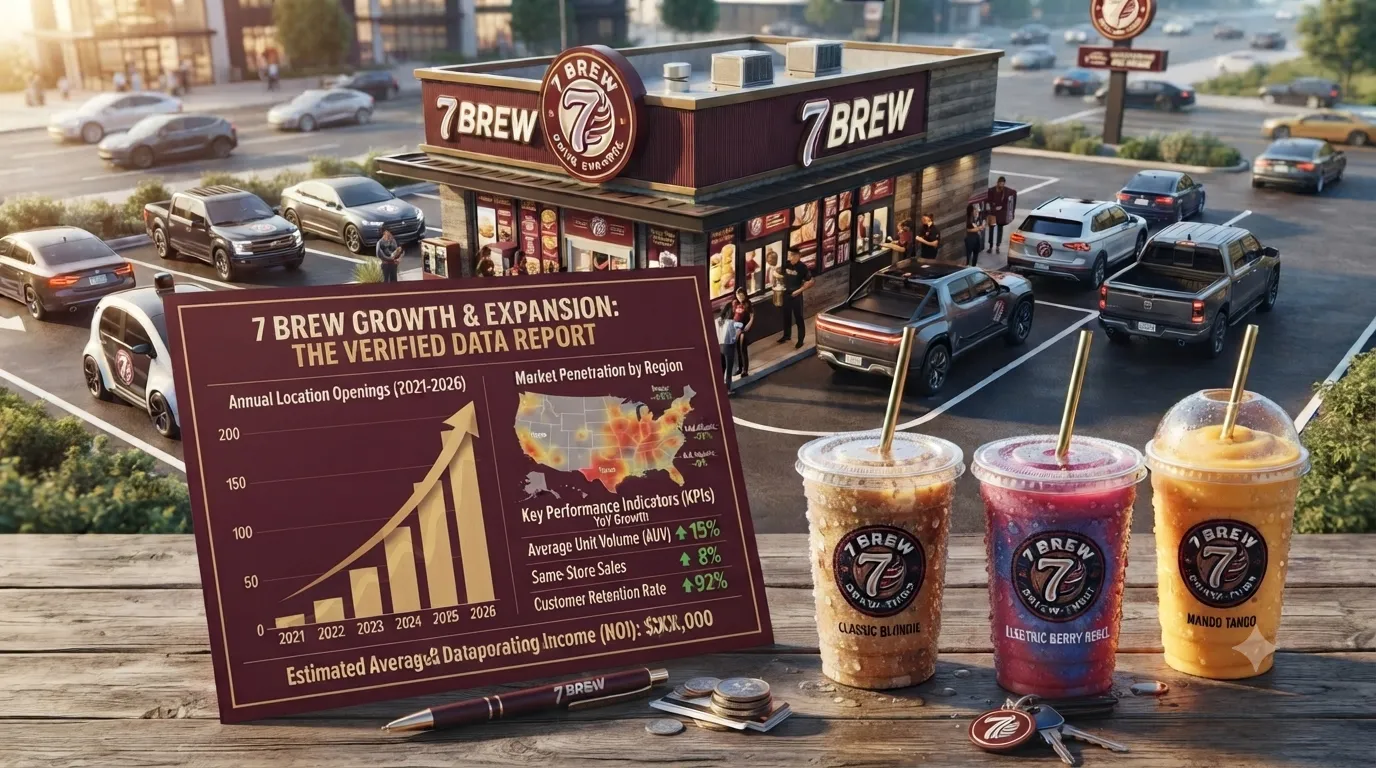
IBISWorld forecasts the industry’s growth rate to decelerate sharply — from the current 2.5% CAGR to just 1.3% annually between 2025 and 2030, projecting total revenues of $79.4 billion by 2030. That deceleration in aggregate growth is the backdrop against which individual chains like 7 Brew are growing extremely fast — by taking share, not by riding category expansion. For a full breakdown of exactly how fast 7 Brew itself is expanding, see 7 Brew Growth & Expansion: The Verified Data Report.
02Drive-Thru Coffee: The Format Taking Share
Within a broadly mature overall market, the drive-thru format has been the standout structural winner. The mechanism is straightforward: a 500–700 square foot drive-thru-only stand operates at substantially lower real estate and labor cost than a full-service cafe with indoor seating, while generating revenue per square foot that is often comparable or higher because the format is optimized entirely around throughput rather than dwell time.
The consumer data is unambiguous. A record 59% of U.S. consumers purchased their coffee at a drive-thru in the National Coffee Association’s Fall 2025 National Coffee Data Trends report — the highest figure the NCA’s ongoing tracking study has ever recorded. This is not a pandemic-era anomaly that has since reversed; it represents a sustained, multi-year shift in how Americans prefer to buy coffee outside the home.
US Consumers Who Bought Coffee at a Drive-Thru — Rising Trend
National Coffee Association NCDT reports — Fall 2025 figure directly sourced; prior years are approximate trend values from NCA tracking data
Bars scaled from 40%–65% y-axis range · Only the Fall 2025 (59%) value is directly cited in the NCA source · Prior years are approximate
The drive-thru format’s market-share gains have come substantially at the expense of traditional independent cafes and full-service chain locations, which have seen declining establishment counts while drive-thru-focused operators have expanded aggressively. One analysis citing IBISWorld data, published by MM CG Invest in March 2026, estimated that total coffee and snack shop establishment counts fell roughly 5.5% between 2020 and approximately 2025 — suggesting that the net increase in business count IBISWorld now reports reflects new-format entrants replacing traditional closures, not purely additive market growth.
Drive-Thru Coffee: Key Format Data Points
What verifiable data says about the drive-thru format’s momentum — sourced individually
Key Takeaway
Drive-thru coffee isn’t a niche within a growing market — it’s the format actively expanding while other formats stagnate or decline. The 59% drive-thru purchase rate from the NCA’s Fall 2025 survey is the single most important consumer-behavior data point in this snapshot.
03Consumer Behavior: Who’s Buying & Why
Coffee’s position in American daily life has never been stronger by the numbers. A 2024 National Coffee Association report established that coffee is the most consumed beverage in the U.S. after water, with 67% of adults drinking it daily — a figure that is 49% higher than it was in 2004. That’s a genuine structural change in consumption habits, not a trend that’s going to reverse.
Within overall coffee consumption, three behavioral shifts stand out as particularly relevant to the drive-thru format’s continued growth:
- Cold coffee is the fastest-growing format. Non-espresso-based beverages — cold brew, frozen blended coffees, nitro — jumped from 12% of adult consumption in 2020 to 17% in 2025, a 42% increase in five years. Drive-thru operations are structurally better positioned to serve cold and blended formats quickly at scale than cafe operations relying on made-to-order espresso drinks alone.
- Customization has become a baseline expectation, not a premium. According to Keurig Dr Pepper’s State of Beverages report, 75% of Gen Z consumers customize their drinks. 7 Brew’s menu architecture — built around a high-customization breve base with 70+ syrup options — directly addresses this expectation in a way most traditional cafe menus don’t.
- Speed remains the primary functional driver. The 59% drive-thru rate is fundamentally about convenience and time efficiency, and that driver doesn’t weaken over time — it strengthens as people’s daily schedules become more complex and tolerance for slow-service environments decreases.
Consumer Behavior Metrics — 2025–2026
Key figures from named industry sources — bars scaled to 100% for comparison
Key Takeaway
The three behavioral tailwinds — cold format growth, customization expectations, and speed preference — all point in the same direction for drive-thru-only concepts. 7 Brew’s menu and format are well-aligned with where consumer behavior is actually heading, not where it was five years ago.
04The Gen Z & Millennial Effect
Generational dynamics are reshaping who drinks coffee and what they expect when they buy it. According to a 2024 NCA study, 67% of Millennials (ages 25–39) and 46% of Gen Z (ages 18–24) consumed coffee in the previous day — figures that have risen substantially over a decade of NCA tracking. In 2026, Gen Z now accounts for roughly 25% of all daily coffee drinkers in the U.S., a number that continues to climb as the youngest members of the generation reach adulthood, according to industry analysis from Pure Earth Coffee citing NCA data.
Several characteristics of younger coffee consumers are distinctly favorable for drive-thru-format brands like 7 Brew:
- 68% of Gen Z consumers prefer cold coffee formats including iced and nitro styles, according to Pro Coffee Gear’s 2025 industry analysis — exactly the format mix that drive-thru operations handle most efficiently.
- 72% of Gen Z consumers try new beverages monthly and 75% customize their drinks, per Keurig Dr Pepper’s State of Beverages report. High-frequency experimentation rewards menus with genuine depth of customization options.
- Gen Z coffee consumption has increased 30%+ since 2020, making this demographic the industry’s fastest-growing demand source.
- Social media has made coffee a cultural identity marker for Gen Z — shareable drinks, photogenic formats, and brand storytelling all matter in ways that didn’t apply to previous coffee generations. 7 Brew’s named drinks and distinctive cups travel well on social platforms.
The Millennial segment tells a slightly different story: now in peak earning and spending years, Millennials are the largest single cohort of specialty coffee consumers and have driven the “premiumization” shift that has pushed average transaction values upward across the category. Both generations together — Millennials and Gen Z — represent the primary growth engine for any coffee brand with ambitions beyond its current footprint.
Gen Z vs. Millennial Coffee Engagement — 2024–2026
Side-by-side comparison from NCA and Keurig Dr Pepper research — gaps noted where data isn’t separately disclosed
| Metric | Gen Z (18–24) | Millennials (25–39) | Source |
|---|---|---|---|
| Daily coffee drinkers | 46% | 67% | NCA, 2024 |
| Prefer cold formats | 68% | Not separately disclosed | Pro Coffee Gear, 2025 |
| Try new beverages monthly | 72% | Not separately disclosed | Keurig Dr Pepper, State of Beverages |
| Customize drinks | 75% | Not separately disclosed | Keurig Dr Pepper, State of Beverages |
| Consumption growth since 2020 | +30%+ | Fastest CAGR of any age group | Pure Earth Coffee, May 2026 |
| Share of daily US coffee drinkers | ~25% | Largest single cohort | Pure Earth Coffee; MM CG Invest |
Key Takeaway
The demographic wave is genuinely favorable for drive-thru coffee: the generations entering peak coffee-spending years are the exact consumers who most prefer cold formats, customization, speed, and shareable brand experiences — all structural advantages of the drive-thru model.
05Competitive Landscape
The drive-thru coffee space in 2026 involves meaningfully different competitive sets depending on how narrowly you define it. At the broadest level, Starbucks remains the largest single operator in the overall U.S. coffee shop category with 18,311 U.S. locations (10-K, FY2025 ended Sep 28 2025), though Starbucks is not a pure drive-thru concept and is currently mid-restructuring (“Back to Starbucks”), with 627 U.S. store closures in Q4 FY2025 alone.
In the drive-thru-specific segment where 7 Brew actually competes, the relevant comparisons are Dutch Bros, Scooter’s Coffee, and The Human Bean:
| Brand | Locations | 2025 Net New | 2026 Target | Model | Source |
|---|---|---|---|---|---|
| 7 Brew | 777 (Jun 10, 2026) | 281 | 447 new | ~96% franchised | BusinessWire; QSR Mag May 2026 |
| Dutch Bros | 1,136 (Dec 31, 2025) | 154 | 181 new | Shifting to company-operated | FY2025 10-K, Feb 2026 |
| Starbucks (US) | 18,311 (Sep 28, 2025) | Net closures in FY25 | Not disclosed | Company-operated + licensed | 10-K, FY2025 |
| Scooter’s Coffee | 849–932 (range, 2025–26) | ~83 | Not disclosed | Franchised | FDD aggregators, Apr 2026 |
| Human Bean | ~150–200 open | Not disclosed | Not disclosed | Franchised | Multiple aggregators conflict |
Drive-Thru Challenger Store Count — Mid-2026
Bars scaled relative to Dutch Bros (largest disclosed count). Starbucks context shown separately — not a direct competitor.
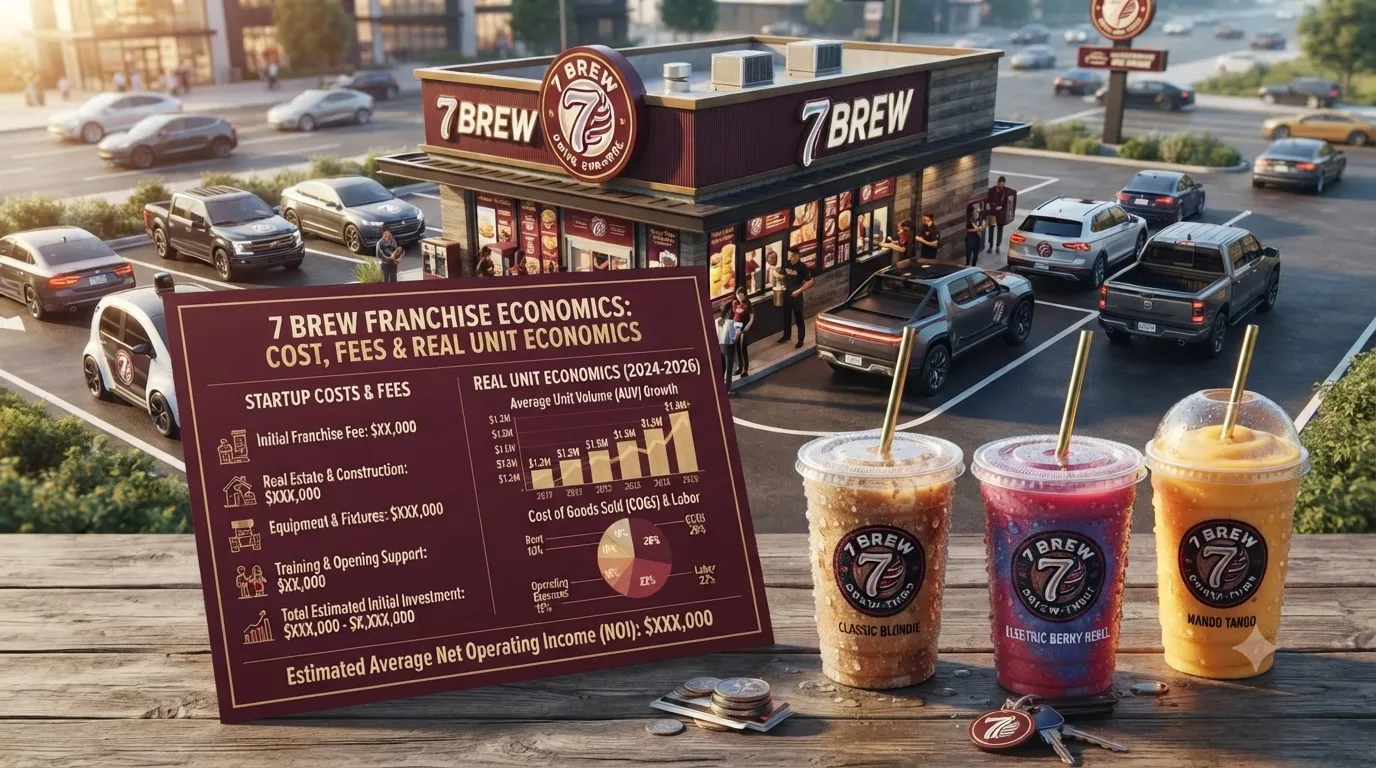
The headline dynamic is clear: 7 Brew is growing unit count at a pace that dwarfs every drive-thru competitor, with 447 planned 2026 openings against Dutch Bros’ 181. But total store count still favors Dutch Bros (1,136 vs. 777), and Dutch Bros’ disclosed system-wide average unit volume of $2.1 million (FY2025 10-K) outpaces 7 Brew’s best-available 2024 AUV estimate of approximately $1.99 million — suggesting the two chains are competing on different dimensions, with 7 Brew prioritizing footprint speed and Dutch Bros prioritizing per-unit economics maturity. For a full breakdown of what it actually costs to open and operate a 7 Brew stand, see 7 Brew Franchise Economics: Cost, Fees & Real Unit Economics.
Starbucks’ competitive relevance to this specific segment is genuinely limited: it operates in a different format (seated cafe + drive-thru hybrid), at a different price point, with a different ownership model (no U.S. franchising). The more meaningful long-run competitive tension is between 7 Brew and Dutch Bros specifically, as both continue expanding into the same Sun Belt and Midwest suburban corridors.
Key Takeaway
The drive-thru coffee segment is effectively a two-horse race in 2026 between 7 Brew and Dutch Bros, with 7 Brew holding the unit-count growth rate advantage and Dutch Bros holding the total location count and per-unit revenue maturity advantage. Scooter’s and Human Bean are meaningful regional players but are not currently growing at a pace that challenges either of the two leaders.
067 Brew’s Position in the Market
7 Brew occupies a specific and deliberately chosen position within the drive-thru coffee segment: high-customization, drive-thru-only, predominantly franchised, Sun Belt and Midwest-focused, and expanding at a pace that makes it the fastest-growing chain in its competitive set by unit-count growth rate.
Several market dynamics work in 7 Brew’s favor right now:
- The drive-thru format is structurally winning. The NCA’s record 59% drive-thru purchase rate confirms that consumer preference is moving toward exactly the format 7 Brew is built around.
- Younger consumers are a tailwind. Gen Z’s preference for cold formats, customization, and speed all align with 7 Brew’s menu architecture and operational model.
- Geographic white space still exists. California, Oregon, and Washington remain entirely untouched as of mid-2026 (with California’s first proposed sites now pending), and the upper Northeast is similarly undeveloped — representing a meaningful addressable expansion runway beyond the company’s current 38+ state footprint. This runway is examined in detail in 7 Brew Growth & Expansion: The Verified Data Report.
- Modular construction enables pace. The 500–700 sq ft prefabricated stand model allows 7 Brew to open locations in weeks rather than months, a structural speed advantage over cafe formats requiring longer buildouts.
At the same time, 7 Brew faces real market constraints that the favorable tailwinds don’t override:
- Market saturation risk in established states. Texas, Florida, Illinois, and Georgia together absorb more than 130 of 2026’s planned openings. As stand density in those states increases, unit-level same-store sales data (not publicly disclosed) will ultimately reveal whether the market can absorb continued build-out or whether earlier markets are approaching diminishing returns.
- Coffee bean price inflation. IBISWorld specifically flags that rising coffee bean and input prices are expected to pressure industry profitability in 2026. Arabica prices reached $13.2 per kilogram in late 2025, up 70.1% from January 2024 levels, according to Grand View Research citing market data. Franchisee unit economics are not publicly disclosed, so the impact on 7 Brew’s system is not verifiable from public sources — see 7 Brew Franchise Economics: Cost, Fees & Real Unit Economics for what is and isn’t publicly known about franchisee-level costs.
- No loyalty program parity with Dutch Bros. Dutch Rewards accounted for 71.6% of Dutch Bros’ Q2 2025 transactions (10-Q). 7 Brew operates a rewards program but has disclosed no comparable participation metric — a meaningful competitive difference for consumer retention at the unit level.
Key Takeaway
7 Brew is well-positioned within a structurally favorable format at a moment of strong consumer tailwinds — but it’s operating in a flat aggregate market where growth is redistributive rather than additive. The question isn’t whether it can keep opening locations; the data is clear that it can. The more important question — what happens to unit-level economics as geographic density increases — remains unanswerable from publicly available information.
07Market Risks & Headwinds
No market snapshot is complete without the factors working against the trend. Several real headwinds face the drive-thru coffee segment in 2026 that deserve direct acknowledgment:
| Risk Factor | Assessment | Severity | Source |
|---|---|---|---|
| Coffee bean price inflation | Arabica prices +70.1% from Jan 2024 to late 2025. IBISWorld expects industry profit to fall as input costs rise. | High | Grand View Research; IBISWorld, 2026 |
| Market maturity / growth deceleration | IBISWorld forecasts industry CAGR slowing from 2.5% (2021–26) to 1.3% (2025–30). Growth is redistributive, not expansionary. | Moderate | IBISWorld; MM CG Invest, Mar 2026 |
| Drive-thru saturation in established markets | 7 Brew, Dutch Bros, and Scooter’s are all expanding in overlapping Sun Belt and Midwest corridors simultaneously. | Moderate | QSR Magazine, May 2026 |
| Home brewing growth among younger consumers | Gen Z is driving a home coffee equipment boom (2024–26), potentially substituting for some out-of-home purchases. | Low-Moderate | Pure Earth Coffee; Pro Coffee Gear, 2025 |
| Loyalty program gap vs. Dutch Bros | Dutch Rewards = 71.6% of Q2’25 transactions. 7 Brew has no disclosed comparable loyalty penetration metric. | Moderate | Dutch Bros Q2 2025 10-Q |
2026 Expansion Plans vs. Input Cost Headwind
Growth momentum on the left — commodity cost pressure on the right
Source: QSR Magazine May 2026 (7 Brew FDD); Dutch Bros FY2025 earnings release
Key Takeaway
Coffee bean price inflation is the most immediate, externally driven risk facing the sector. The structural risks — market maturity and geographic saturation — are real but longer-cycle concerns that won’t fully manifest in 2026 data. Investors and franchise operators should weigh both near-term (input cost) and medium-term (saturation ceiling) risk factors against the genuine demographic and format tailwinds this report has documented.
08Key Statistics Center
09Frequently Asked Questions
10Sources & Methodology
All market-size figures, consumer statistics, and competitive data in this report are sourced from named, dated publications. No figure was estimated or invented. Where sources conflict on methodology or scope, this report explains the difference explicitly.
- IBISWorld, “Coffee & Snack Shops in the US,” Industry Analysis 2026
- IBISWorld, Market Size Statistics — Coffee & Snack Shops in the US, 2026
- National Coffee Association, “National Coffee Data Trends,” Fall 2025 report
- National Coffee Association, 2024 consumption and daily drinker data
- Perfect Daily Grind, “Coffee shop trends to watch out for in 2026,” Jan 28 2026
- Keurig Dr Pepper, “State of Beverages” inaugural report (Gen Z customization data)
- Dutch Bros Inc., FY2025 Q4 & Full-Year Earnings Release, Feb 12 2026
- Dutch Bros Inc., Q2 2025 10-Q (Dutch Rewards loyalty data)
- Starbucks Corporation, Form 10-K, Fiscal Year 2025, Nov 14 2025
- QSR Magazine, “The Race Between 7 Brew and Dutch Bros is Officially On,” May 20 2026
- BusinessWire, “Jackpot! 7 Brew Celebrates Landmark 777th Stand,” Jun 10 2026
- Grand View Research, “Coffee Market Report: Size, Growth, Trends & Forecast (2025–2033),” 2026
- MM CG Invest, “U.S. Coffee Shop Industry: Market Analysis,” Mar 22 2026
- Verified Market Research, “Coffee Market Report,” April 2026
- Pure Earth Coffee, “Why Gen Z Is Drinking More Coffee Than Any Previous Generation,” May 11 2026
- FranchiseInvestorData.com, Scooter’s Coffee Analysis, Apr 29 2026
- This report’s companion analyses: 7 Brew Growth & Expansion: The Verified Data Report and 7 Brew Franchise Economics: Cost, Fees & Real Unit Economics (Jun 2026)