7 Brew Franchise Economics: Cost, Fees & Real Unit Economics
What it actually costs to open a 7 Brew, what the disclosed 2024 financial performance data really shows, and why most “ROI” claims circulating online overstate what’s publicly known. Every figure cross-referenced. Every conflict disclosed.
In This Report
- Executive Summary & Methodology
- Initial Investment Breakdown
- Franchise Fees & Royalty Structure
- Qualification Requirements
- 2024 Item 19 Financial Performance
- Understanding EBITDAR
- Illustrative Payback Model
- Modular Construction & Cost Efficiency
- Financing Options
- Risk Factors & Disclosure Gaps
- Statistics Center
- Frequently Asked Questions
- Sources & Methodology
01Executive Summary & Methodology
Anyone researching what it actually costs to open a 7 Brew franchise quickly runs into a problem: no two sources agree. Search for “7 Brew franchise cost” and you’ll find initial investment figures ranging from $887,000 to $2,284,000, franchise fees quoted anywhere from $35,000 to $45,000, and average unit volume estimates spanning $1.3 million to $2.55 million — sometimes on the same page, citing the same Franchise Disclosure Document.
This report exists to sort that out. Rather than picking whichever number sounds best, we cross-referenced every figure against multiple independent sources, flagged outright contradictions, and — critically — identified the handful of data points that two or more unrelated sources corroborate with identical specificity, which is the strongest signal available that a figure traces back to an actual FDD filing rather than another website’s guess.
The good news: one data set survived this scrutiny cleanly. Two independent franchise-research sites, with no apparent relationship to each other, report identical 2024 Item 19 financial performance figures down to the dollar — average gross sales of $1,989,229, a median of $1,921,485, a high of $3,978,338, and a low of $888,964, alongside a store-level EBITDAR margin of 28.99%. That level of matching specificity is the closest thing to verification available without purchasing the FDD directly, and it forms the backbone of this report’s financial analysis.
What This Report Does Differently
Section 7 builds an illustrative payback calculation using only corroborated figures — and explicitly labels it a best-case ceiling, not a forecast, because rent, debt service, taxes, and depreciation aren’t included in EBITDAR and aren’t disclosed at the store level anywhere in the public record. Any source presenting a confident single “ROI” or “breakeven in X months” figure for 7 Brew is going beyond what the public data actually supports.
02Initial Investment Breakdown
FDD Item 7 requires franchisors to disclose the full range of costs a new franchisee can expect before opening. For 7 Brew, this figure varies meaningfully depending on which source and which FDD year you’re reading, but a consistent picture emerges once outliers are set aside.
Investment Range by Source
High end of range cited by each independent source — shown to make the conflict visible, not resolved into one false-confidence number
| Source | Investment Range | Notes |
|---|---|---|
| Franzy.com | $890,300 – $1,934,500 | Cites 2024 FDD; midpoint $1,412,400 |
| FranchisePayback.com | $887,000 – $1,849,000 | Cites 2023 FDD |
| FranDB.com | $894,000 – $2,178,500 | Most detailed breakdown reviewed |
| BizFranHub.com | $894,000 – $2,178,500 | Matches FranDB exactly |
| SharpSheets.io | $941,000 – $2,284,000 | Highest range cited; no FDD year specified |
Three independent sources converge on a range close to $890,000–$2,180,000, with two matching almost exactly. This report uses that range as the most defensible current estimate, while flagging that it likely reflects the 2024 or 2025 FDD rather than the most recent 2026 filing — meaning the true 2026 figure is plausibly somewhat higher.
One detail worth flagging for prospective multi-unit operators: 7 Brew’s franchise system requires a minimum development commitment of multiple units — sources put this at 2 to 5 stores, with one source specifying “at least five stores upfront” for new development agreements, and at least one source noting a separate $75,000 development fee that may apply to the first store. This means the investment figures above likely need to be multiplied across several units before a franchisee is approved to start, not treated as a single-location decision point.
Key Takeaway
The most defensible current estimate for 7 Brew’s total initial investment is approximately $890,000 to $2,180,000 per location — but this should be treated as a planning range, not a precise number, both because of genuine source disagreement and because most prospective franchisees are evaluating a multiple of this figure across required multi-unit commitments.
03Franchise Fees & Royalty Structure
The upfront franchise fee also shows source disagreement, though the spread is narrower than the investment range. Two sources cite $35,000; a third, specifically dated “2026,” cites $40,000. This report treats $35,000–$40,000 as the more likely current range.
Ongoing royalty structure shows a more substantive conflict — not just a dollar amount, but a disagreement about the type of fee structure. One source describes a flat 6% royalty. Another describes a flat 7%. A third — the most detailed source reviewed — describes a tiered structure starting at 4.5% of weekly gross sales and scaling up to 7% as volume increases.
Tiered Royalty Structure (Illustrative)
Best-detailed single source; flat-rate alternatives (6% or 7% flat) exist in other sources
Illustrative scaling structure — single-source, moderate confidence
| Fee Type | Most-Cited Figure | Confidence |
|---|---|---|
| Initial franchise fee | $35,000–$40,000 | Moderate |
| Royalty (likely structure) | Tiered, 4.5%–7% | Moderate |
| Marketing/brand fund | 2% of gross sales | Moderate-High |
| Technology fee | 0.25% of gross sales | Low-Moderate |
| Multi-unit development fee | ~$75,000 (1st store) | Low |
Stacking these together: a franchisee at the lower royalty tier (4.5%) paying the marketing fund (2%) and technology fee (0.25%) would owe roughly 6.75% of gross sales in combined ongoing franchisor fees — rising to roughly 9.25% at the top royalty tier. This combined-fee framing is this report’s own calculation from individually-sourced components, shown so readers can see exactly how it was derived.
Key Takeaway
7 Brew’s ongoing fee structure most likely totals somewhere between roughly 6.75% and 9.25% of gross sales depending on sales volume — though the royalty structure specifically (tiered vs. flat) is the least certain of the components reviewed.
04Qualification Requirements
Beyond the capital required to build a location, 7 Brew’s franchise system imposes financial qualification thresholds. One source — moderate confidence, not independently corroborated — cites a minimum net worth requirement of $1,000,000 and minimum liquid assets of $300,000.
This combination — high per-unit investment, multi-unit minimum commitments, and a seven-figure net worth requirement — points toward a franchise system designed around experienced, well-capitalized multi-unit operators rather than first-time, single-location franchise buyers. That positioning is consistent with publicly reported franchisee activity: Franchise Equity Partners’ 2025 acquisition of 7 Brew’s second-largest franchisee (a group that also operates Jersey Mike’s and Wingstop locations) fits this pattern directly.
Financing options mentioned across sources are largely standard mechanisms: SBA loans, conventional bank financing, and ROBS (Rollover for Business Startups) structures letting franchisees use retirement funds without early-withdrawal penalties. None of the sources disclosed 7 Brew-specific lender relationships or financing assistance.
Key Takeaway
7 Brew’s qualification bar points toward a system built for experienced, well-capitalized operators rather than first-time franchise buyers — a conclusion supported by both the disclosed requirements and observed franchisee activity in the system.
052024 Item 19 Financial Performance
Item 19 of an FDD is where a franchisor may — but is not required to — disclose actual financial performance data. 7 Brew does include Item 19 data, and for 2024 specifically, this report found two independent sources reporting identical figures — a level of matching specificity that strongly suggests both are drawing from the actual FDD table.
2024 Revenue Distribution
Dual-sourced, high confidence — average and median figures, plus the disclosed high/low range
The gap between average ($1,989,229) and median ($1,921,485) is relatively modest — about 3.5% — suggesting the distribution isn’t being dramatically skewed by a small number of extremely high-performing outlier stores. But the spread between highest and lowest performing locations is enormous: the top store generated roughly 4.5 times the revenue of the bottom store. Location quality appears to matter enormously in this system, and the average figure says relatively little about what any individual new location should expect.
Neither source disclosed how many total locations were included in this 2024 sample — a meaningful gap, since sample size materially affects how representative average and median figures are of the system as a whole.
It’s worth directly addressing the AUV figures that did not make it into this report’s core data: estimates of $1.3–1.7 million (explicitly labeled “unconfirmed” by its own source), a flat $2.0 million (no FDD-year attribution), and figures as high as $2.38–2.55 million (also lacking clear sourcing). None carry the same corroboration as the $1,989,229 figure used here.
Key Takeaway
The best-available, dual-sourced 2024 average unit volume for 7 Brew is $1,989,229, with a wide performance spread (4.5x) between top and bottom-performing locations that should temper expectations that a new location will automatically perform at the system average.
06Understanding EBITDAR: What 28.99% Actually Means
This section exists because the 28.99% EBITDAR figure is the single most commonly misunderstood number in franchise economics content, and getting it wrong leads directly to overstated profitability expectations.
EBITDAR stands for Earnings Before Interest, Taxes, Depreciation, Amortization, and Rent. It’s a standard metric in lease-heavy industries specifically because it lets you compare operating performance across businesses with very different real estate structures — which is also exactly why it’s the wrong number to treat as “profit.”
From Revenue to Unknown Net Profit
What’s disclosed (revenue, EBITDAR) vs. what isn’t (real net profit after rent, debt, taxes, depreciation)
Before arriving at real net profit, a 28.99% EBITDAR margin still has to absorb, at minimum: rent or mortgage payments on the real estate (explicitly excluded by definition), debt service on any financed portion of the investment, income taxes, and depreciation/amortization of equipment and buildout. None of these four categories are disclosed at the per-store level in any source reviewed, which means a precise, verified net-profit figure cannot currently be calculated from public data — not because the math is hard, but because the inputs aren’t published.
One source — FranDB.com — provides a second, more conservative metric: a “Post-Royalties, Brand Fund, and Technology Fee EBITDAR” margin of 19.74%, already net of the ongoing franchisor fees discussed in Section 3. This is a meaningfully more useful starting point for franchisee-level financial planning, which is why this report uses it as the basis for Section 7’s payback calculation — though it carries lower confidence than the dual-sourced 28.99% headline figure, since it wasn’t independently corroborated by a second source.
Key Takeaway
A 28.99% EBITDAR margin is a real, well-corroborated, and genuinely strong operating metric by restaurant-industry standards — but it is not profit. Rent, debt service, taxes, and depreciation all still apply and remain undisclosed at the store level. Any content presenting this figure as “franchisee earnings” is misrepresenting what it measures.
07Illustrative Payback Model — With Full Assumptions Shown
This section does something most franchise economics content doesn’t do: shows its work completely, so the limitations of the calculation are as visible as the calculation itself.
Using only the corroborated inputs — $1,989,229 average 2024 revenue and the 19.74% post-fee EBITDAR margin — implied post-fee EBITDAR in dollar terms is:
Calculation
$1,989,229 × 19.74% = $392,674 post-fee EBITDAR
Illustrative Best-Case Payback Ceiling
Investment range ÷ post-fee EBITDAR — excludes rent, debt service, taxes & depreciation
Excludes rent, debt service, taxes & depreciation — real payback will be longer
| Investment Level | Post-Fee EBITDAR | Payback Ceiling |
|---|---|---|
| $894,000 (low end) | $392,674/yr | 2.3 years |
| $2,178,500 (high end) | $392,674/yr | 5.5 years |
This is a ceiling, not a forecast. Real payback periods will be longer — in some cases substantially longer — once actual rent, debt service, taxes, and depreciation are subtracted. A franchisee with a high-rent urban site and significant financing leverage could see real payback meaningfully beyond the 5.5-year ceiling; a franchisee who paid cash for a lower-investment site with modest rent could land closer to 2.3 years, or better if their location outperforms the system average. The 4.5x spread documented in Section 5 makes clear individual outcomes vary enormously.
This is also why this report does not provide three-scenario (conservative/expected/aggressive) modeling, and does not assign a single “expected ROI” percentage — doing either would require assumptions about rent, financing terms, and tax situation that vary enormously by individual franchisee, and presenting a confident-looking model built on undisclosed inputs would create false precision rather than genuine insight.
One piece of secondary-source commentary this report explicitly excludes: a single, uncorroborated claim that “most stores reach breakeven in 10 to 18 months.” No FDD citation or second corroborating source was found, and it doesn’t reconcile cleanly with the payback-ceiling math shown above. Readers encountering that claim elsewhere should treat it with significant skepticism.
Key Takeaway
Using only corroborated inputs, the fastest theoretically possible payback period for a 7 Brew location is approximately 2.3 to 5.5 years — a best-case ceiling that excludes rent, debt service, taxes, and depreciation, all of which will extend real payback periods further.
08Modular Construction & Cost Efficiency
A meaningful share of 7 Brew’s investment-range spread, and a structural reason the format has attracted rapid franchise development, traces back to its physical construction model. Every 7 Brew stand is a 500–700 square foot prefabricated modular unit, built off-site and installed on a prepared pad rather than constructed on-site from the ground up.
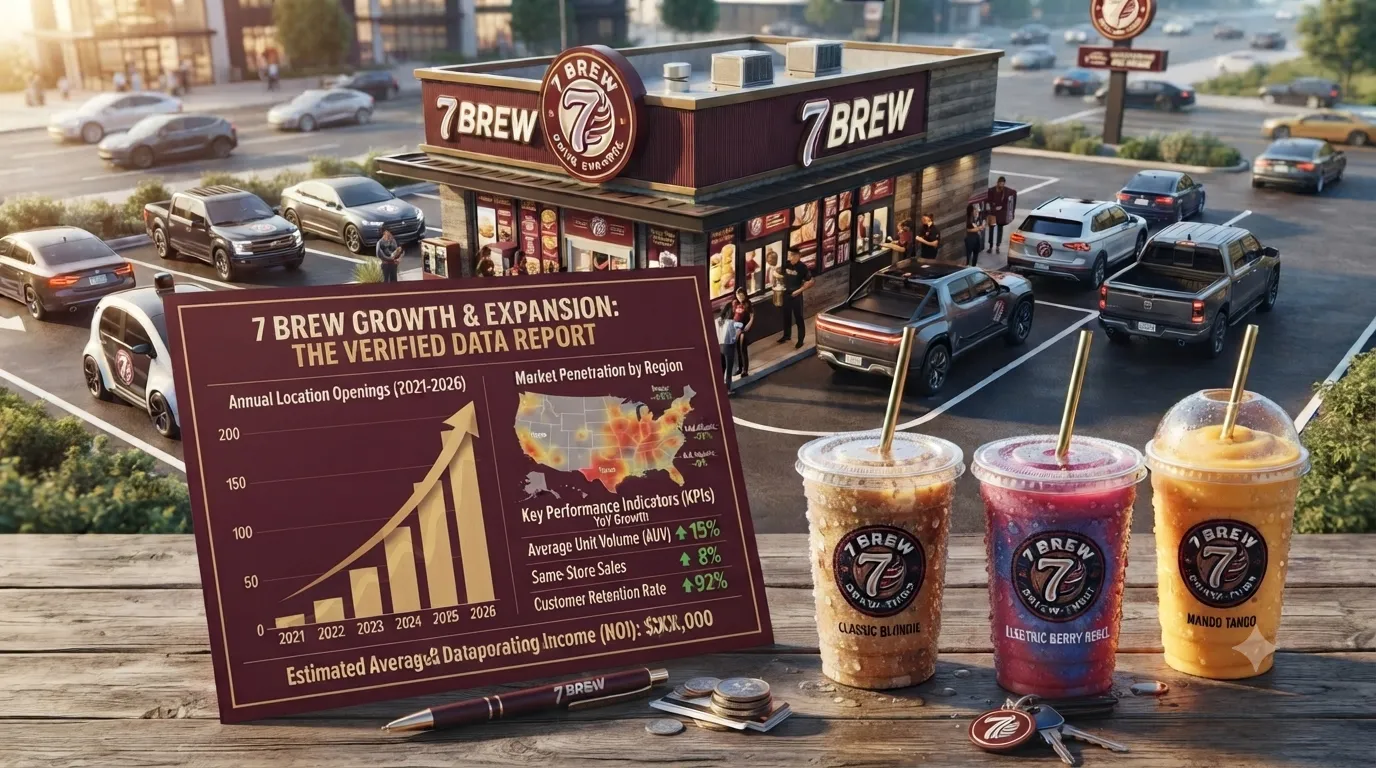
This construction approach has direct economics implications: it reduces carrying costs (rent, loan interest, insurance) during construction before revenue arrives, and it reduces exposure to construction-cost inflation and delays relative to a traditional ground-up build. Neither effect is quantified in any source reviewed — no source disclosed average construction-to-opening timelines for 7 Brew specifically — but the directional logic is well-established in quick-service real estate development, and it’s consistent with the brand’s documented ability to open 30+ new locations per month at peak pace, part of a broader expansion trajectory covered in 7 Brew Growth & Expansion: The Verified Data Report.
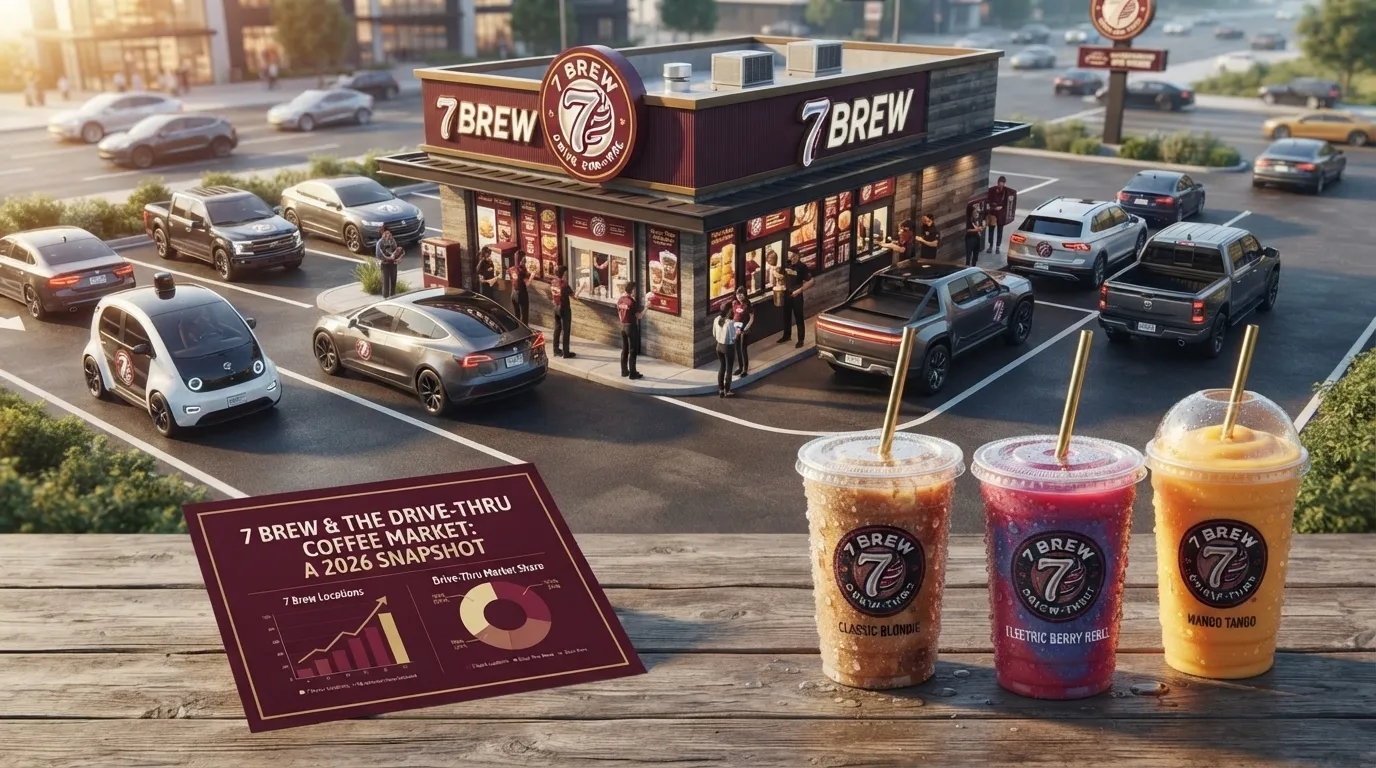
The format’s small footprint also has an indirect benefit: lower real estate costs relative to a full-service cafe requiring indoor seating and a larger building footprint. It’s also a direct structural fit with the demand shift documented in 7 Brew & the Drive-Thru Coffee Market: A 2026 Snapshot, where drive-thru now accounts for a record share of how Americans buy coffee. What this report cannot quantify: an exact cost-per-square-foot figure for 7 Brew’s modular construction, a clean comparison to competitor FDD figures, or how construction costs have trended across 7 Brew’s own filings from 2023 through 2026.
Key Takeaway
7 Brew’s modular construction model plausibly contributes to both faster time-to-revenue and lower real estate costs — but the specific dollar magnitude isn’t disclosed publicly, so this section presents directional logic rather than quantified savings.
09Financing Options
Sources mention several standard franchise financing mechanisms, none specific to 7 Brew itself:
- SBA loans — commonly used across franchise systems; no source disclosed an SBA franchise registry listing or preferred-lender relationships specific to 7 Brew.
- Conventional bank financing — subject to standard lender underwriting, not franchisor-specific.
- ROBS (Rollover for Business Startups) — allows using retirement funds (401(k), IRA) to capitalize a new business without early-withdrawal penalties, mentioned in two sources specifically because of 7 Brew’s relatively high capital requirements.
None of the sources disclosed what percentage of franchisees typically finance versus pay cash, typical loan-to-value ratios, or whether 7 Brew maintains direct lending relationships — meaningful gaps for modeling realistic cash-at-close requirements.
Key Takeaway
Financing options appear to be standard, system-agnostic tools rather than anything 7-Brew-specific, and no source disclosed financing-specific data that would let this report model realistic cash-at-close scenarios beyond the gross investment range.
10Risk Factors & Disclosure Gaps
This section consolidates the meaningful financial unknowns this report encountered — gaps a prospective franchisee should explicitly fill via direct FDD review before making an investment decision.
- Sample size behind the Item 19 averages — not disclosed by any source, which materially affects how much weight the average/median figures deserve.
- Real net profit — the 28.99%/19.74% EBITDAR figures are not profit, and no source disclosed actual net income at the store level.
- Franchisee turnover and closure rates — no source disclosed closure or transfer data, a standard FDD disclosure item this research pass could not locate.
- Exact construction cost breakdown — directional logic is sound, but no dollar-level breakdown was found.
- Current 2026-specific FDD figures — most sources cite 2024–2025 data; given the system’s growth from ~470 to 777+ locations across that window (detailed in 7 Brew Growth & Expansion: The Verified Data Report), current figures may differ meaningfully.
- Geographic variation — the 4.5x performance spread makes clear system averages mean little for any specific market; no source broke down performance by state.
Key Takeaway
These gaps aren’t failures of this report’s research — they’re gaps in what 7 Brew, like most privately held franchisors, is required or chooses to disclose. Treat this report, and every other secondary source covering 7 Brew’s franchise economics, as a starting point for due diligence, not a substitute for direct FDD review and professional advice.
11Franchise Economics Statistics Center
12Frequently Asked Questions
13Sources & Methodology
All figures synthesized from franchise research aggregator sites citing 7 Brew’s FDD, cross-referenced for corroboration. No statistic was invented. Where sources conflicted, this report shows the conflict explicitly.
- SharpSheets.io, “7 Brew Franchise FDD, Profits & Costs (2026)”
- PeerSense.com, “7 BREW Franchise FDD, Costs & Fees (2026)”
- Franzy.com, “7 Brew Franchise Analysis: Cost, FDD & More”
- FranchisePayback.com, “7 BREW Franchise FDD, Costs & Fees (2026)”
- BizFranHub.com, “7brew Franchise Costs, Earnings and FDD 2025”
- FranDB.com, “7 Brew Franchise: $894K-$2.2M Cost, 297 Locations Growing 84%”
- This report’s companion analyses: 7 Brew Growth & Expansion: The Verified Data Report and 7 Brew & the Drive-Thru Coffee Market: A 2026 Snapshot (Jun–Jul 2026)